Some Data!
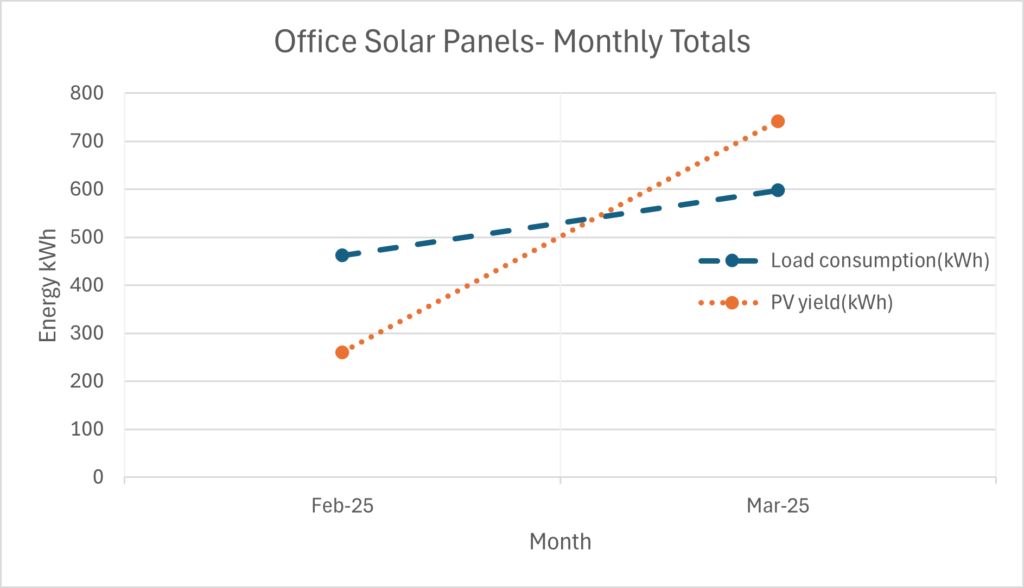
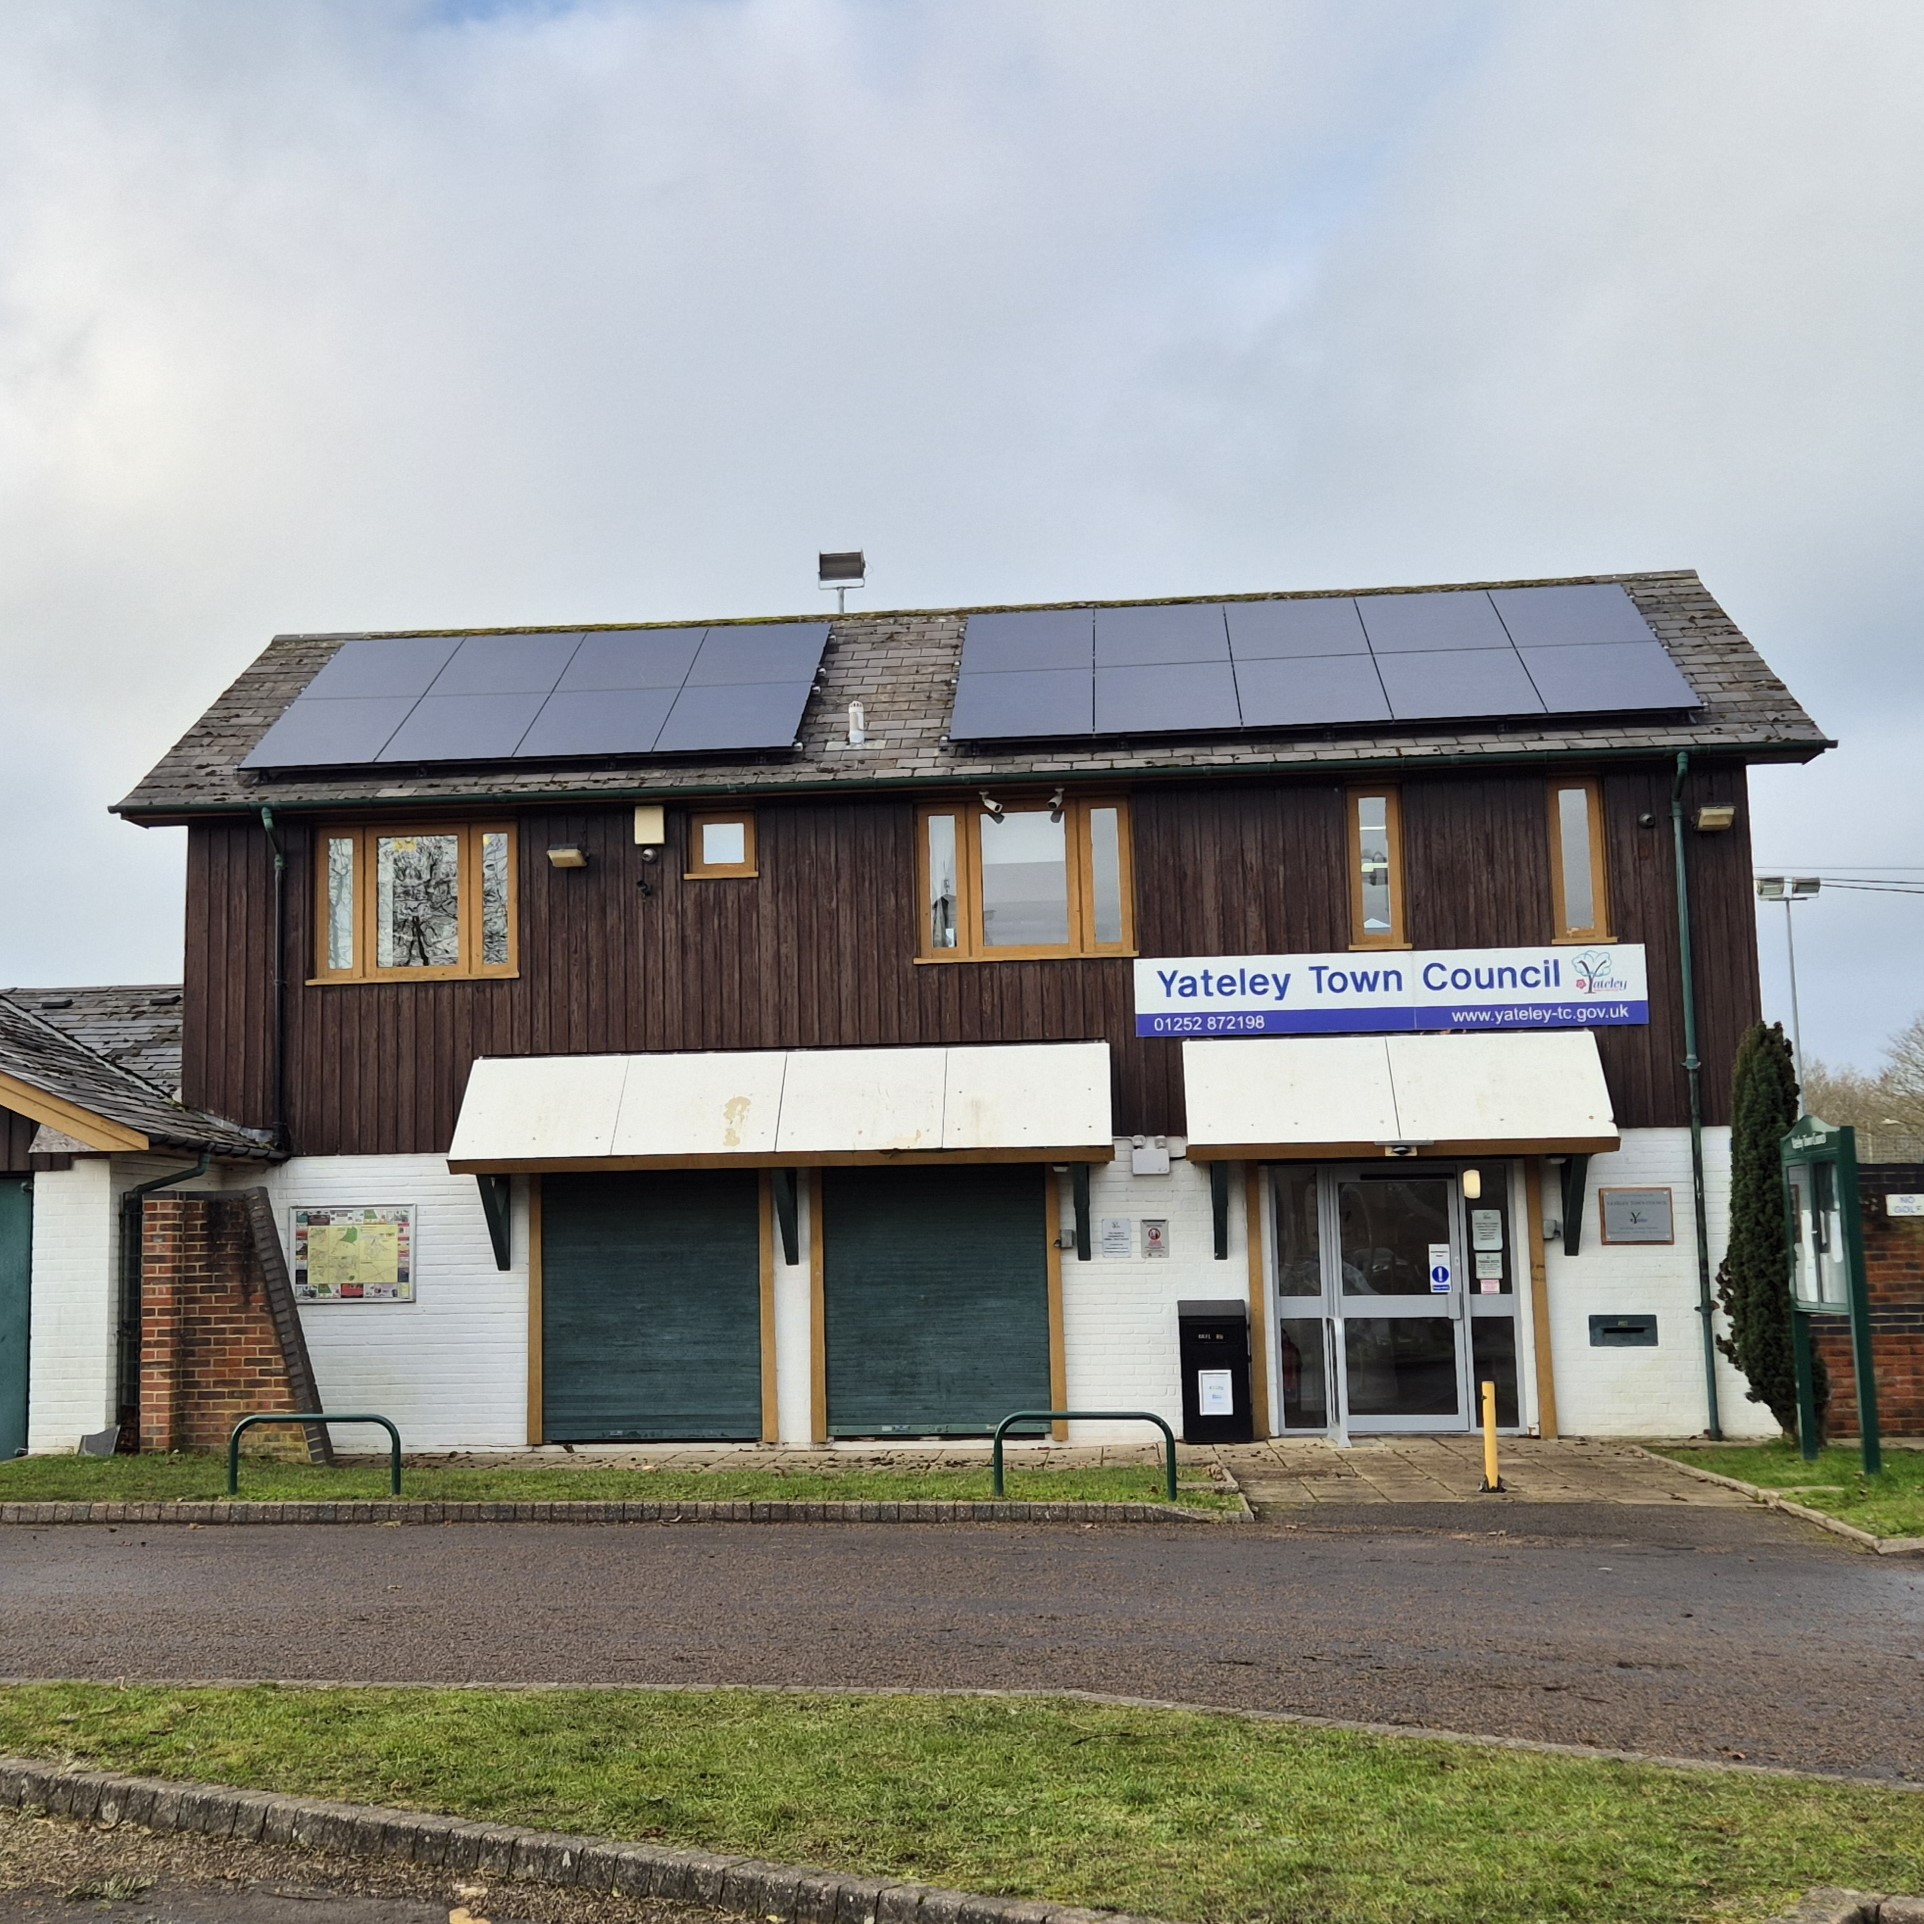
We are very excited to share some of the data that have come from the solar panels mounted on our office. This only covers February and March as the panels were installed part of the way through January and we, therefore, cannot share a full month of data from then. While we are still learning how the battery works and interacts with taking electricity from the Grid, we are only looking at our consumption and the yield from the panels.
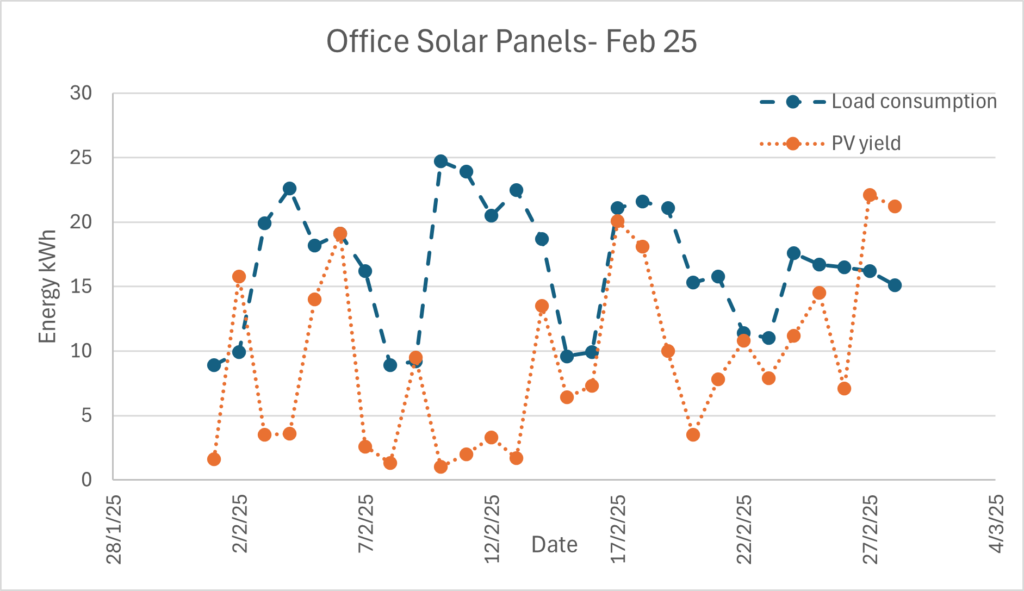
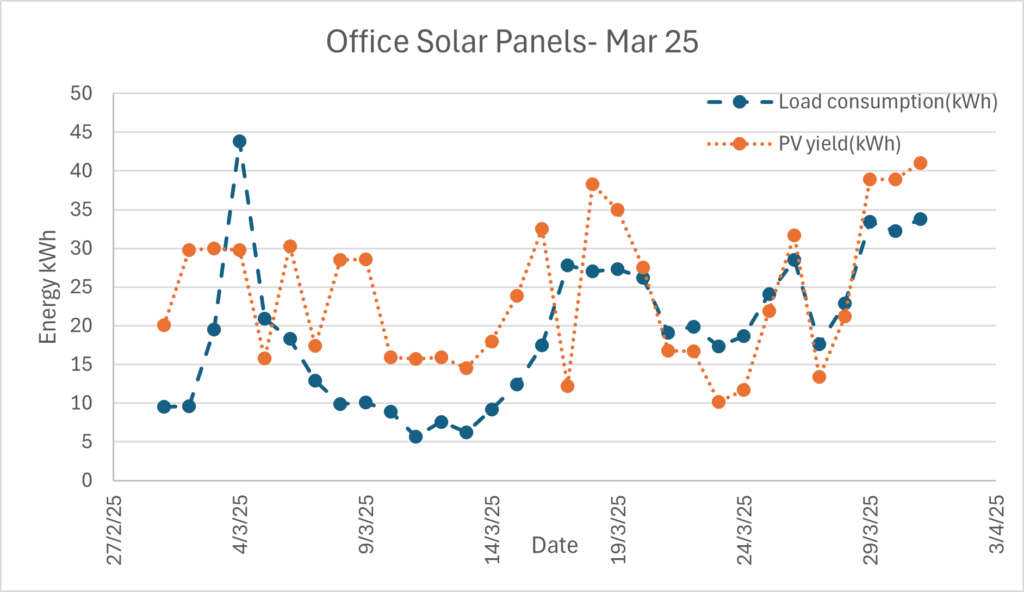
As you can see from the graphs above, both our consumption and the yield from the solar panels varies quite significantly. Our consumption is obviously lower at weekends when the office is closed and the yield of the solar panels is dependent on sunshine and how long the day is, so it is not that surprising that there are more days in March where the yield is higher than our consumption. This is very clear in the graph below, which shows the monthly totals for consumption and yield, where the electricity generated by the solar panels is higher than our consumption in March. Based on these data, we expect the office to be produce more electricity than used from the grid from March to September.